Data310_workbook
Project 2: Demographics and Health Data for Jordan
Country Introduction:
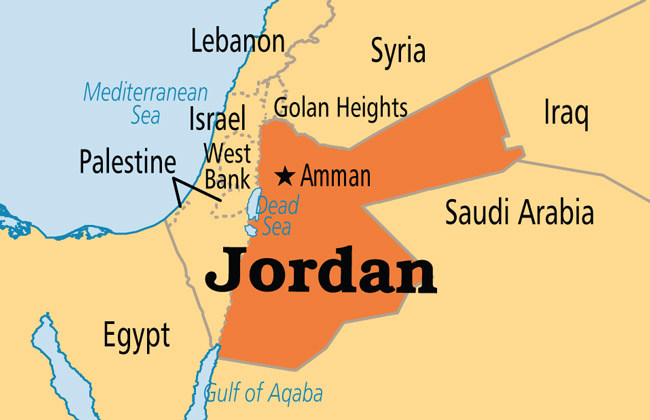
Located in the Middle East, Jordan is a country with a population of 6.5 million residing in 89,342 sq km. It is located in a pivotal place between Israel, West Bank, Syria, Iraq, and Saudi Arabia. Because of its important location, understanding the wealth and wealth’s influencing factors is vital.
Project Introduction/Summary:
Using DHS (Demographics and Health) Program data, I downloaded 2017-18 Standard DHS data for Jordan. I used four models to test the data to better understand wealth distribution in Jordan. The models we used were a logistic regression model, a random forest model, a linear estimator logistic regression, and a gradient boosting model. I compared the four models against each other to see which model best predicted the wealth categories in Jordan.
Project Questions
Penalized Logistic Regression
- Using the R script provided, split and sample your DHS persons data and evaluate the AUC - ROC values you produce.
-
Which “top_model” performed the best (had the largest AUC)?
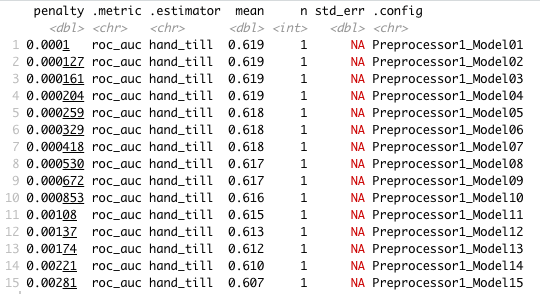

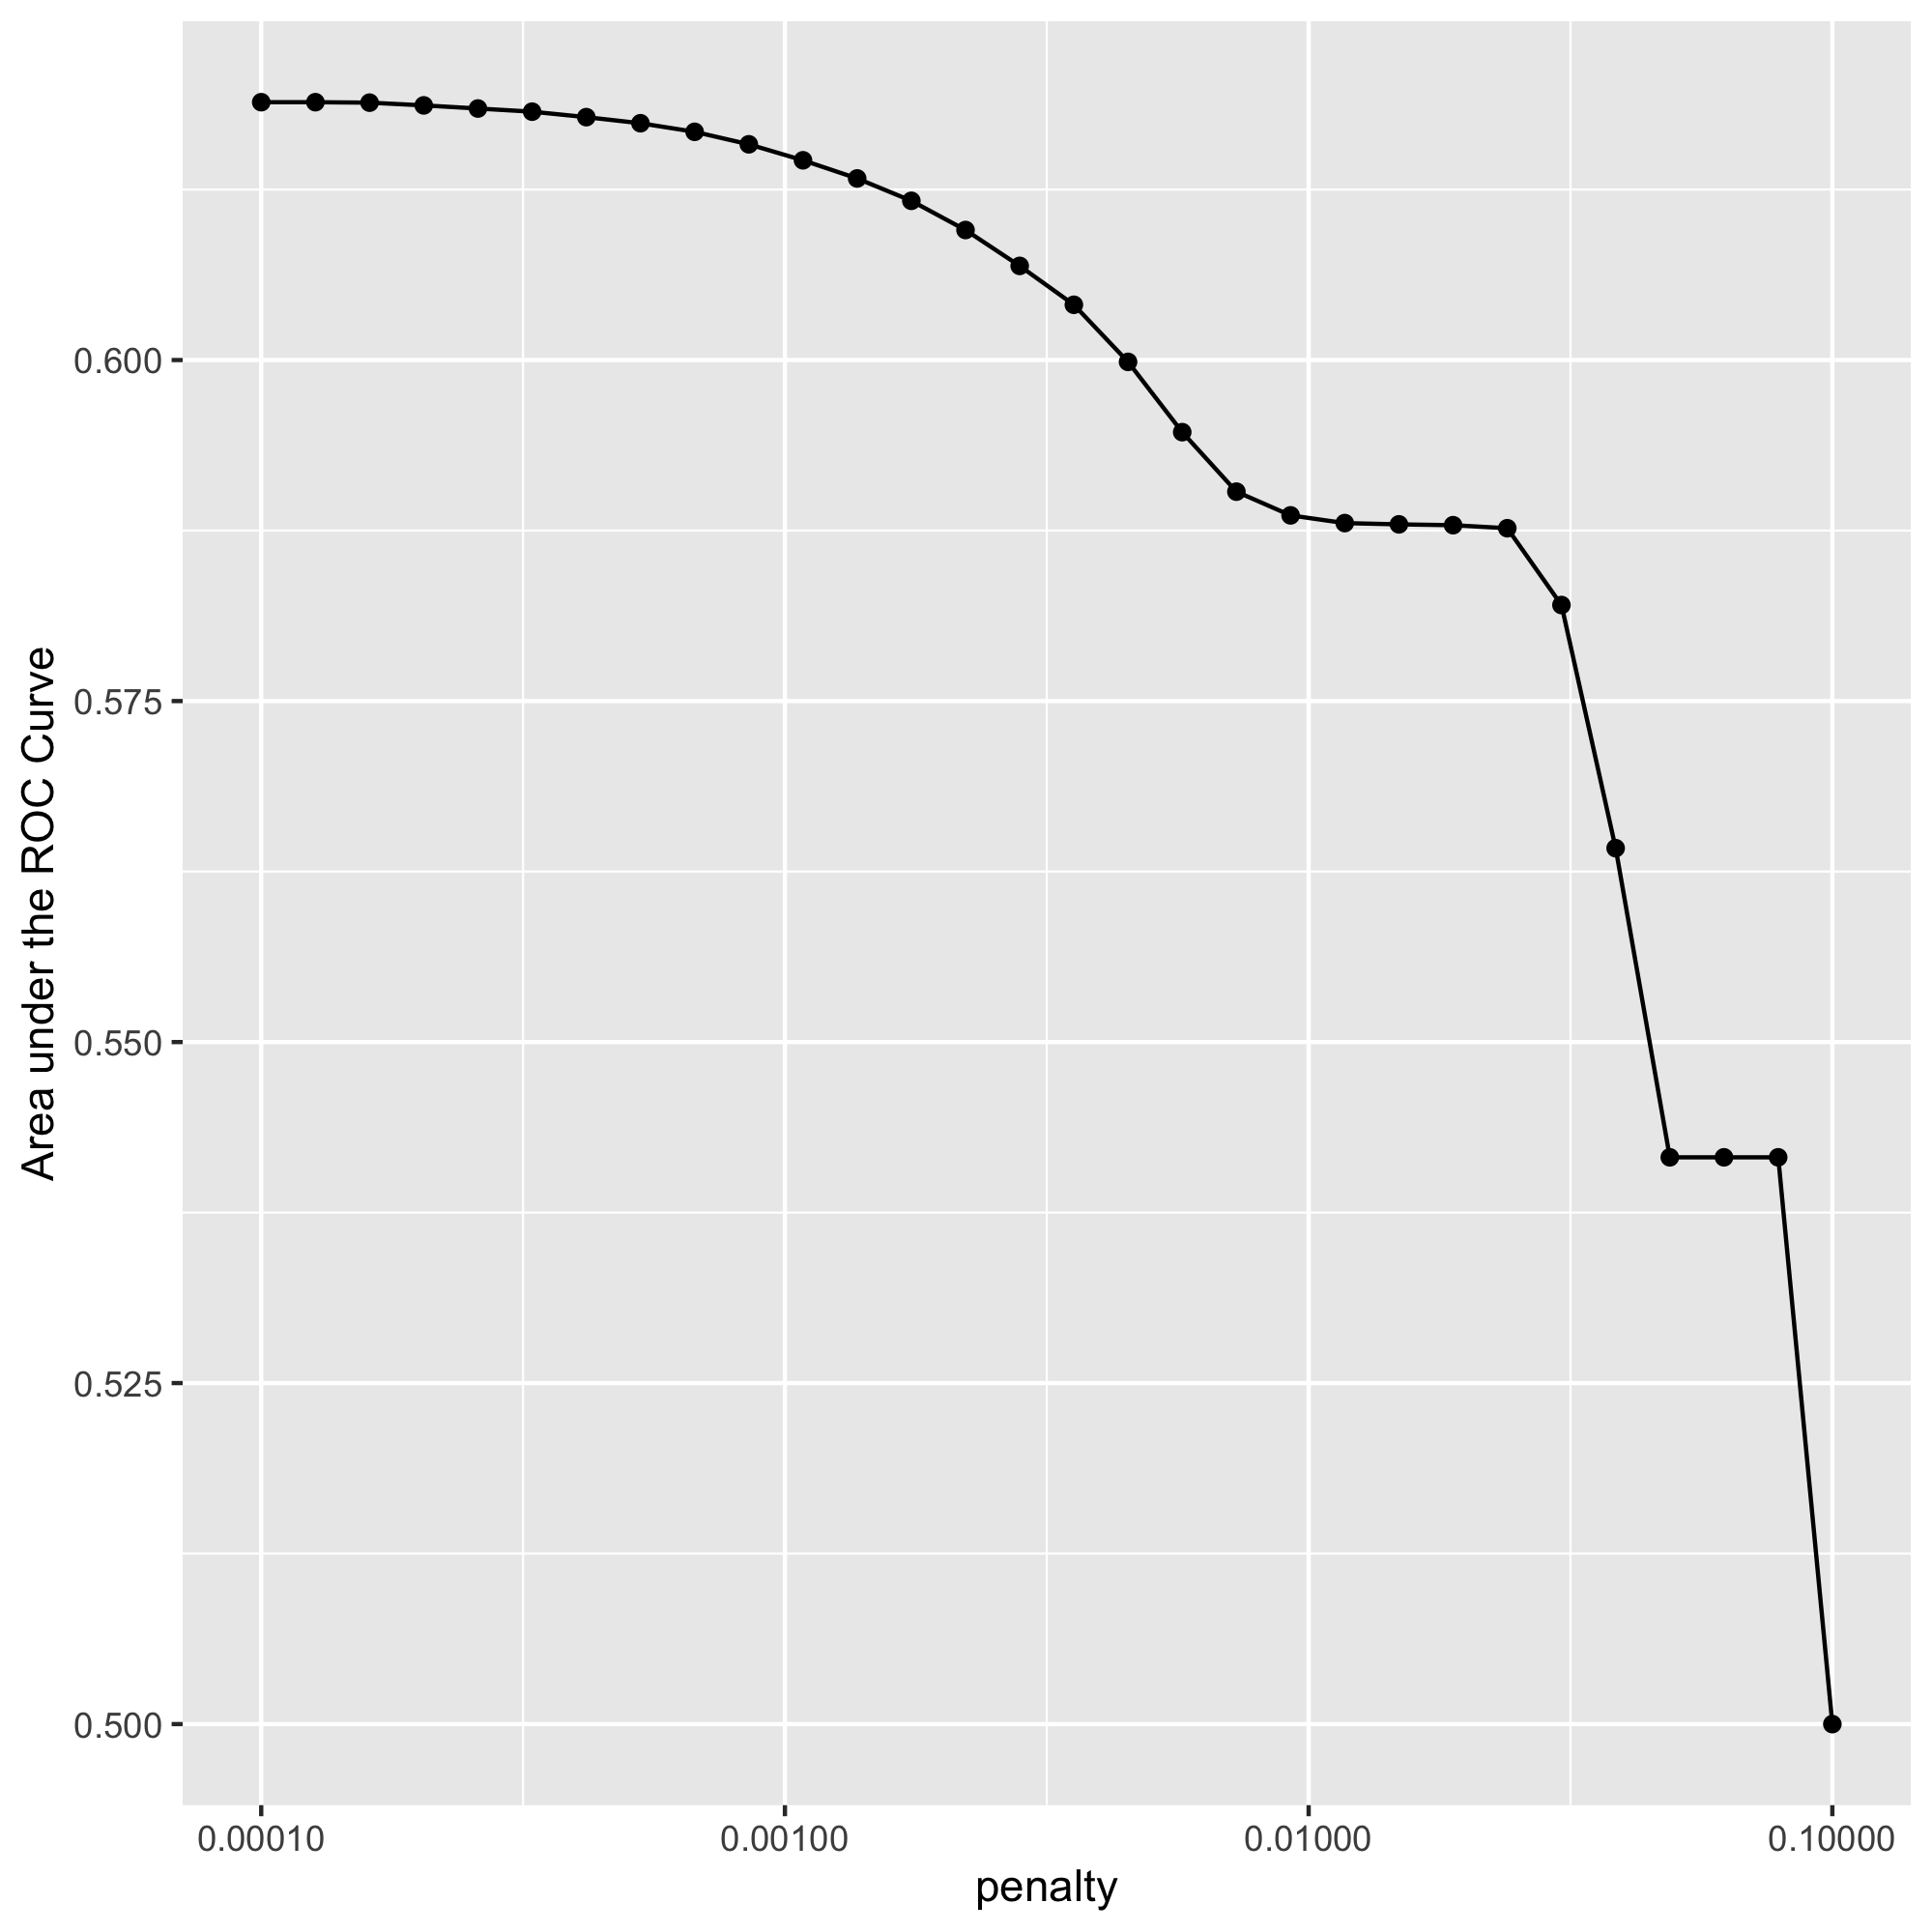
The penalty drops off after 0.00108, which is why model 11 is the best (has the most area under the curve).
-
How effective is your penalized logistic regression model at predicting each of the five wealth outcomes.
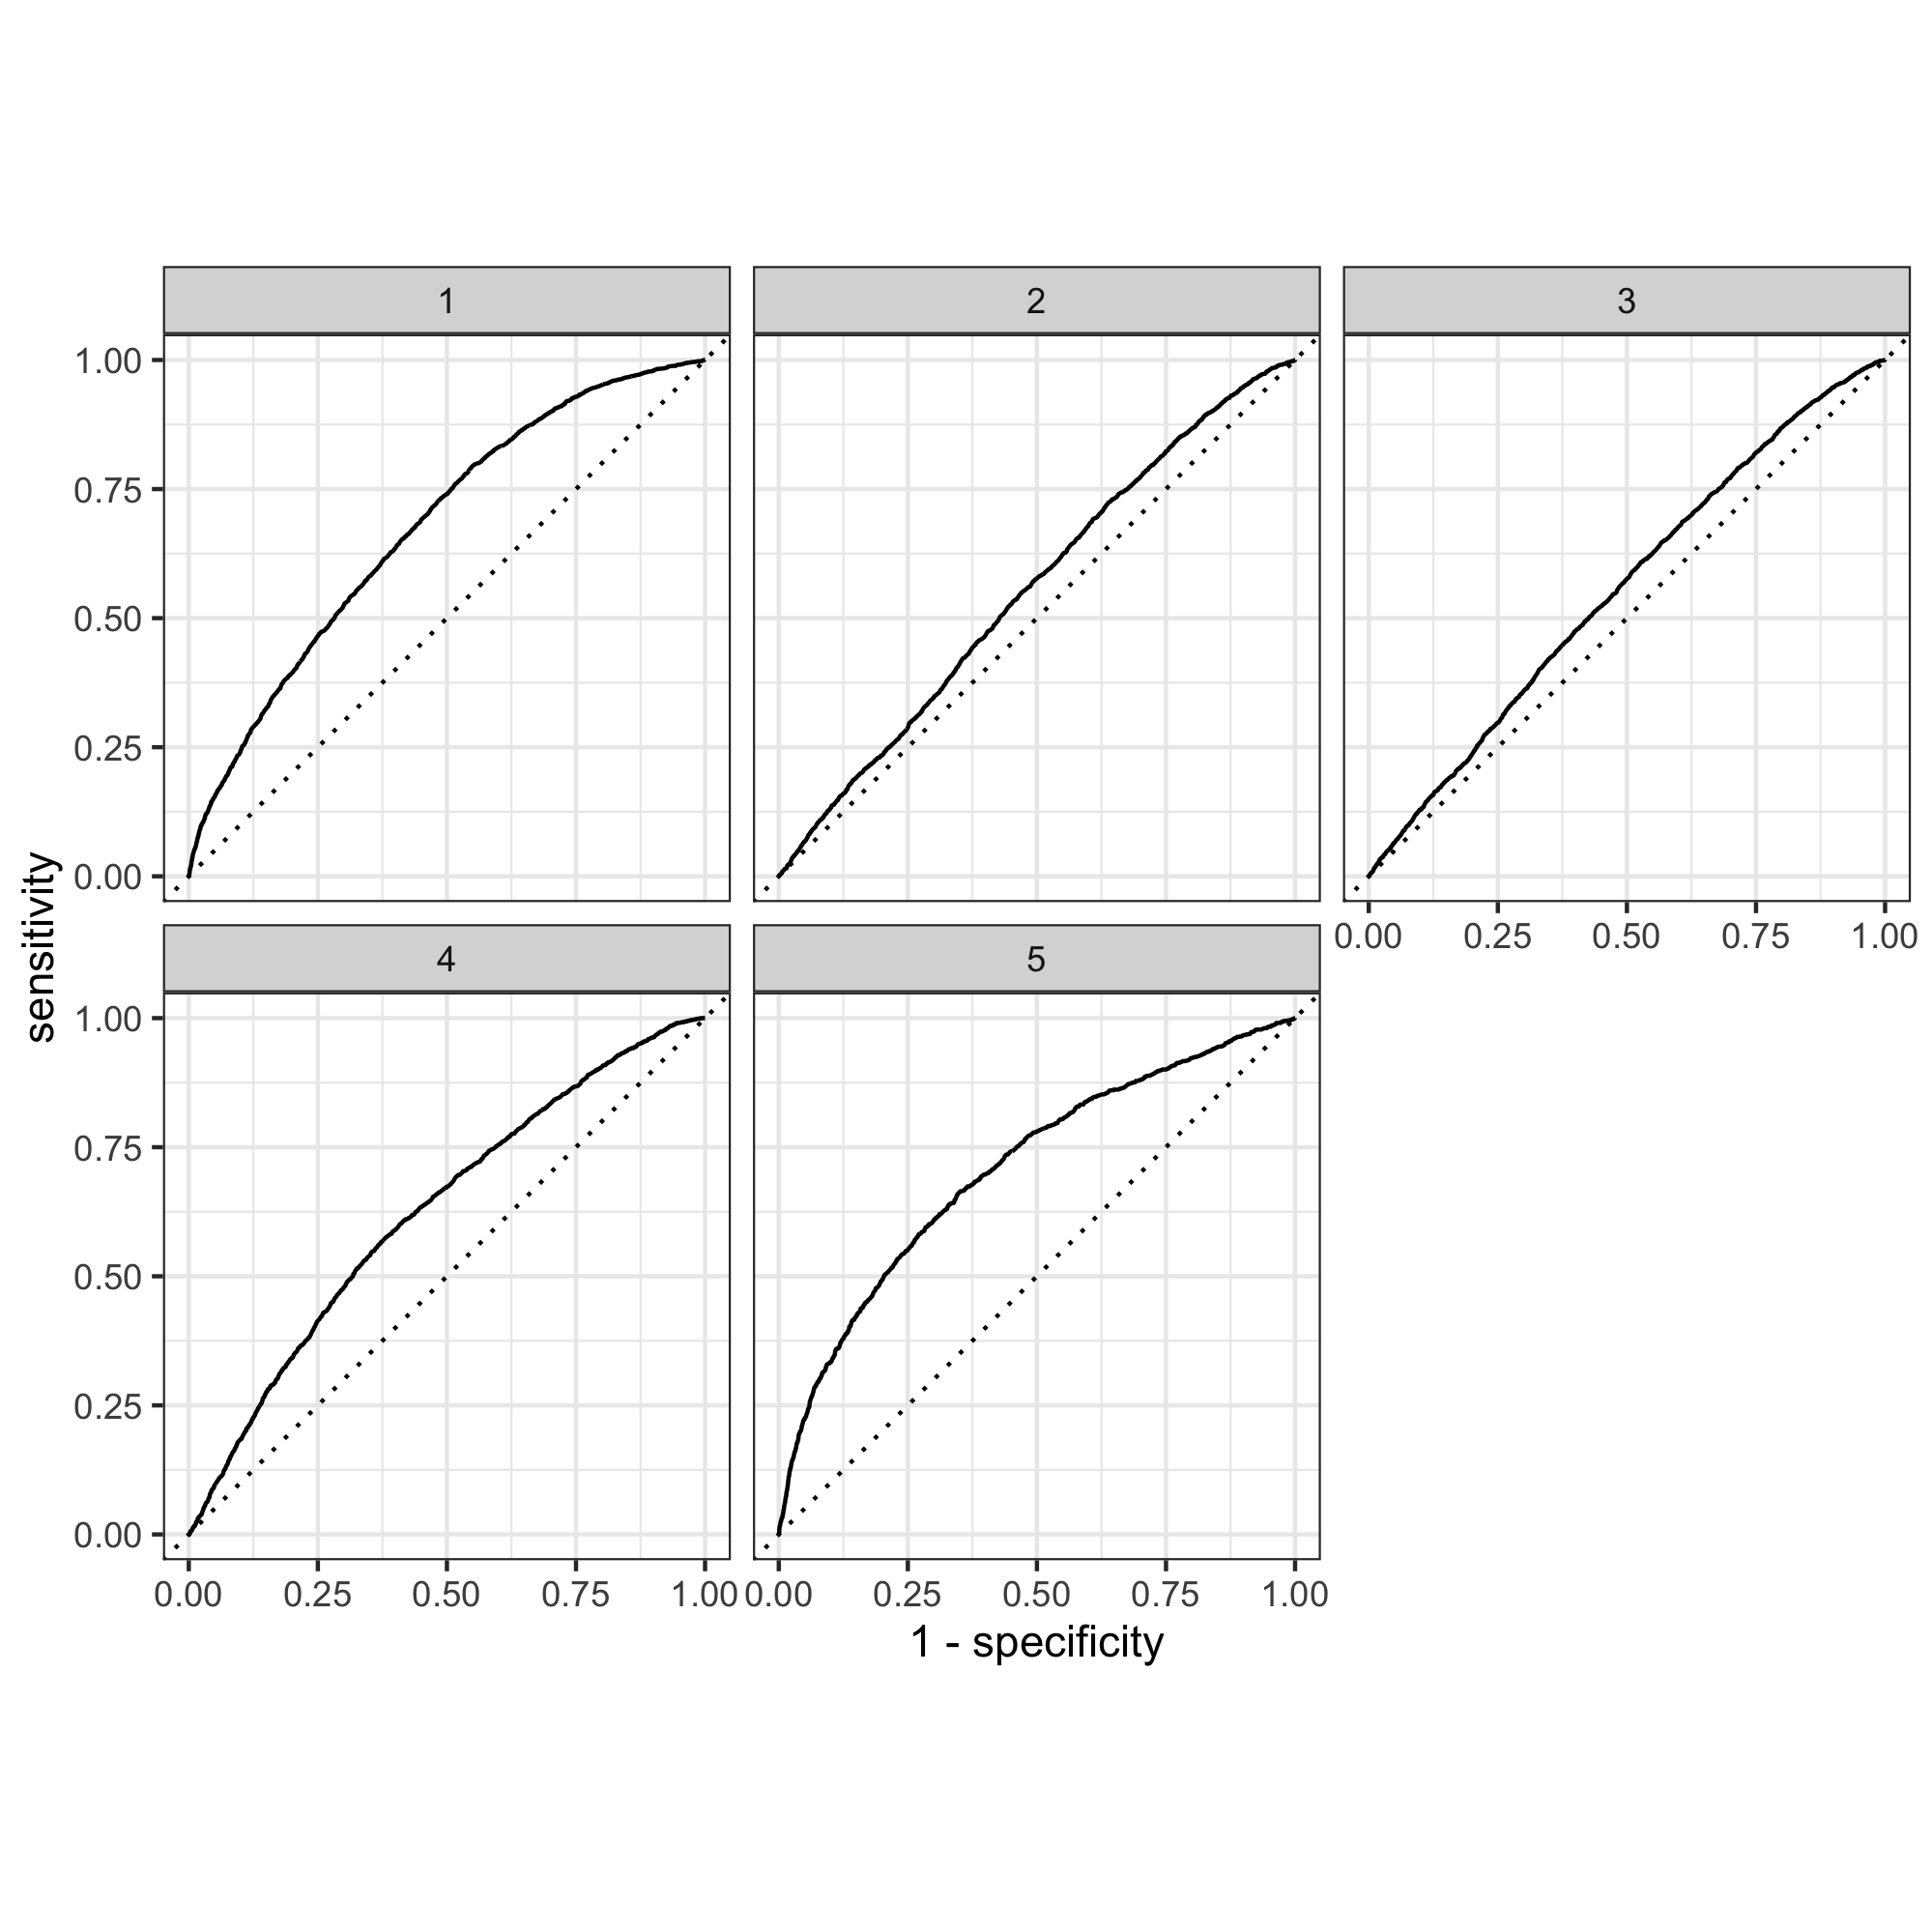
These curves show that the model is relatively good at detecting wealth categories 1, 4, and 5, but not differentiating between 2 and 3. This means that the model is not great at differentiating people that fit into the two middle wealth brackets.
-
Random Forest
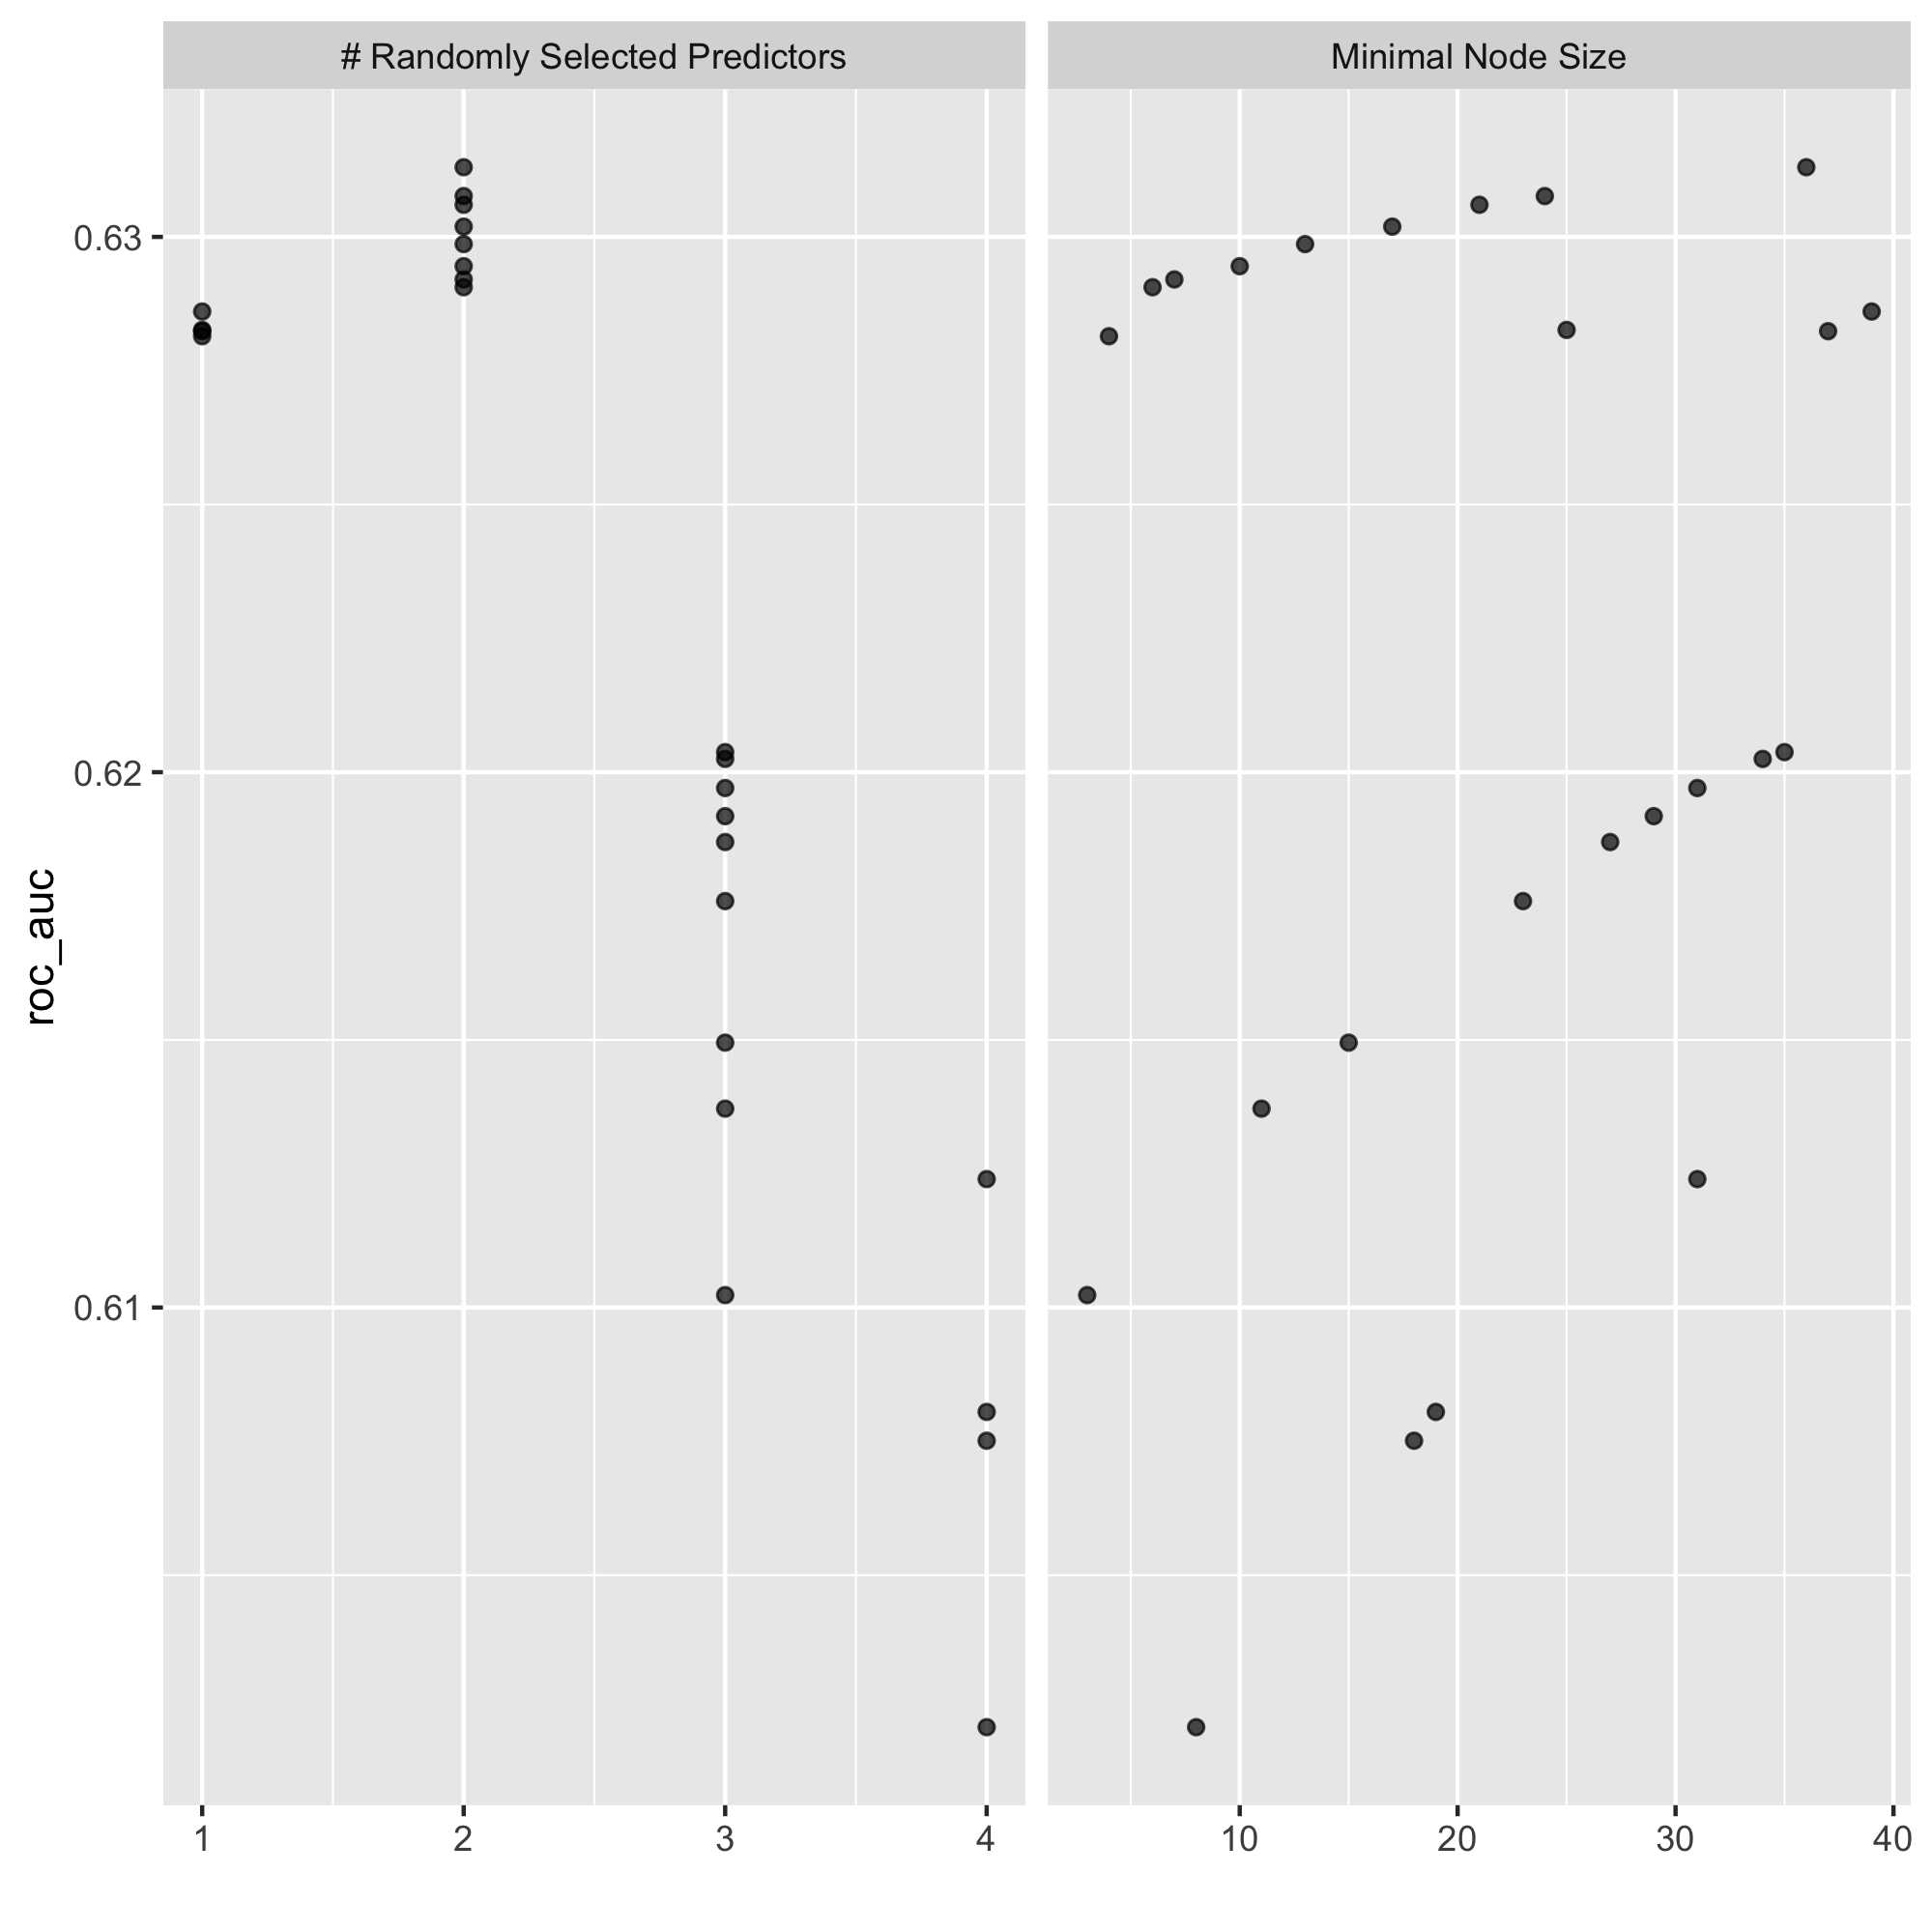
- Using the R script provided, set up your random forest model and produce the AUC - ROC values for the randomly selected predictors, and the minimal node size, again with wealth as the target.
-
How did your random forest model fare when compared to the penalized logistic regression?
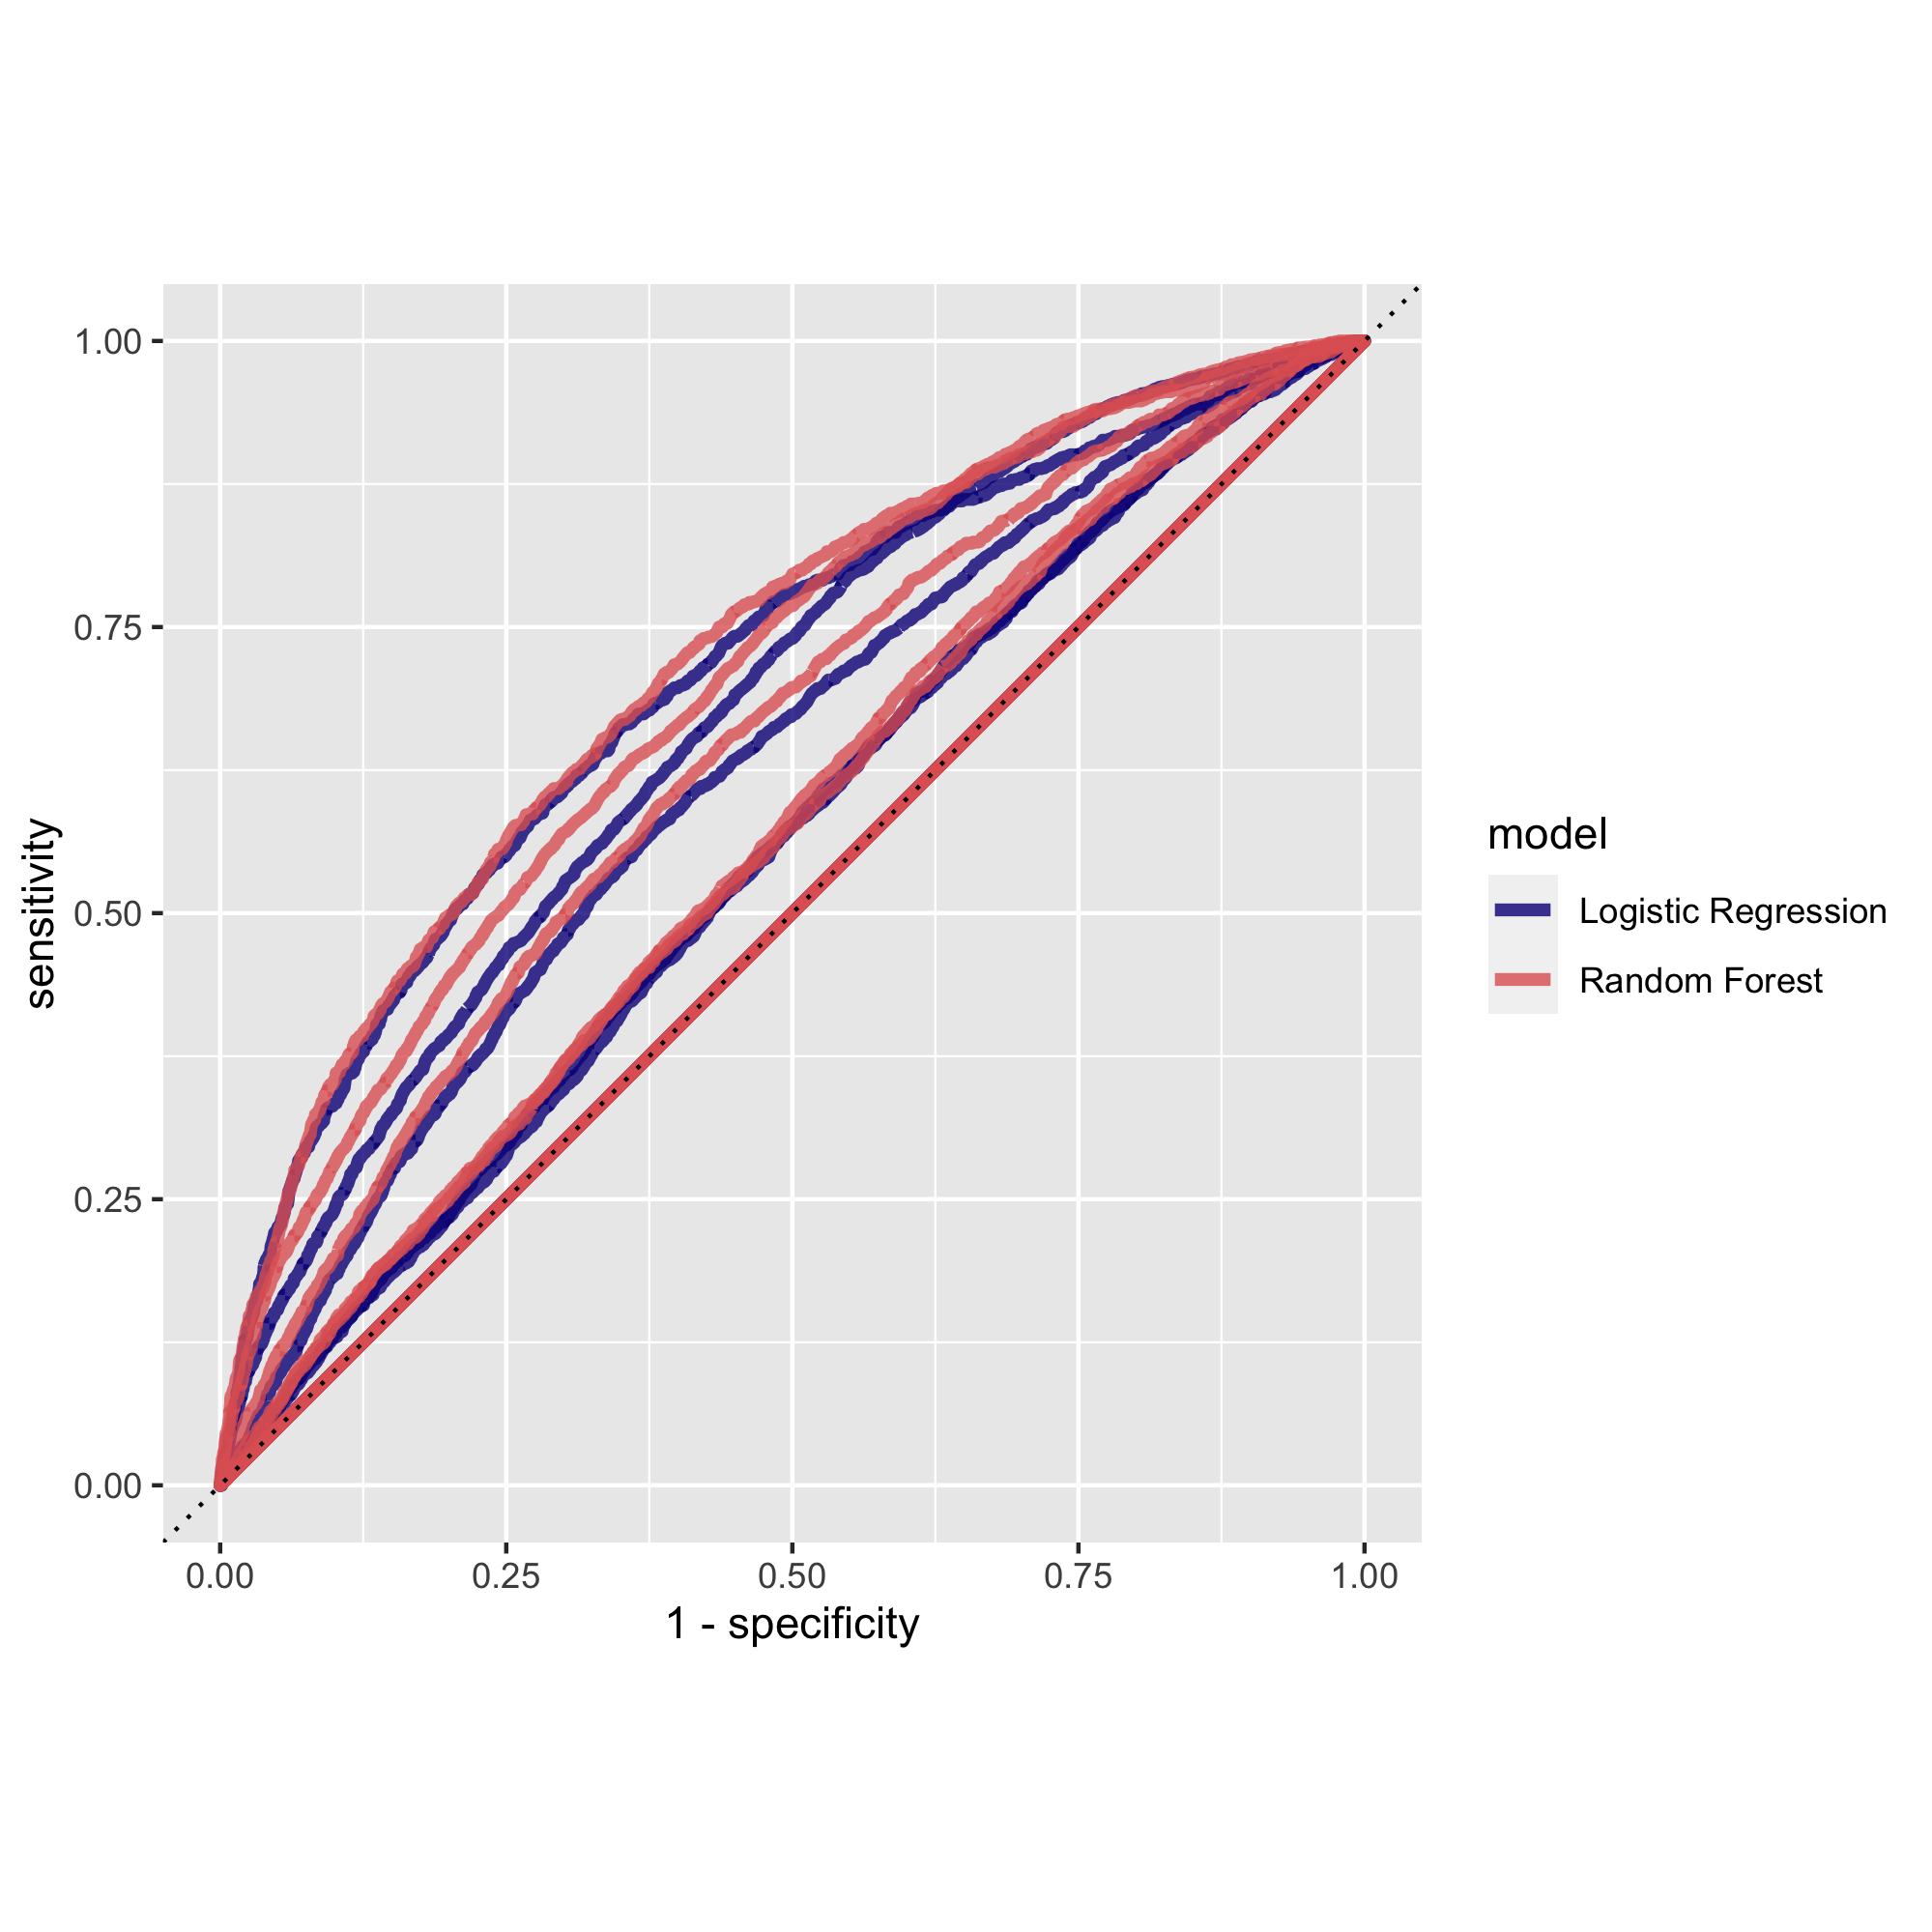
The two models seemed to perform almost the same. Perhaps the random forest model performed better.
-
Provide your ROC plots and interpret them.
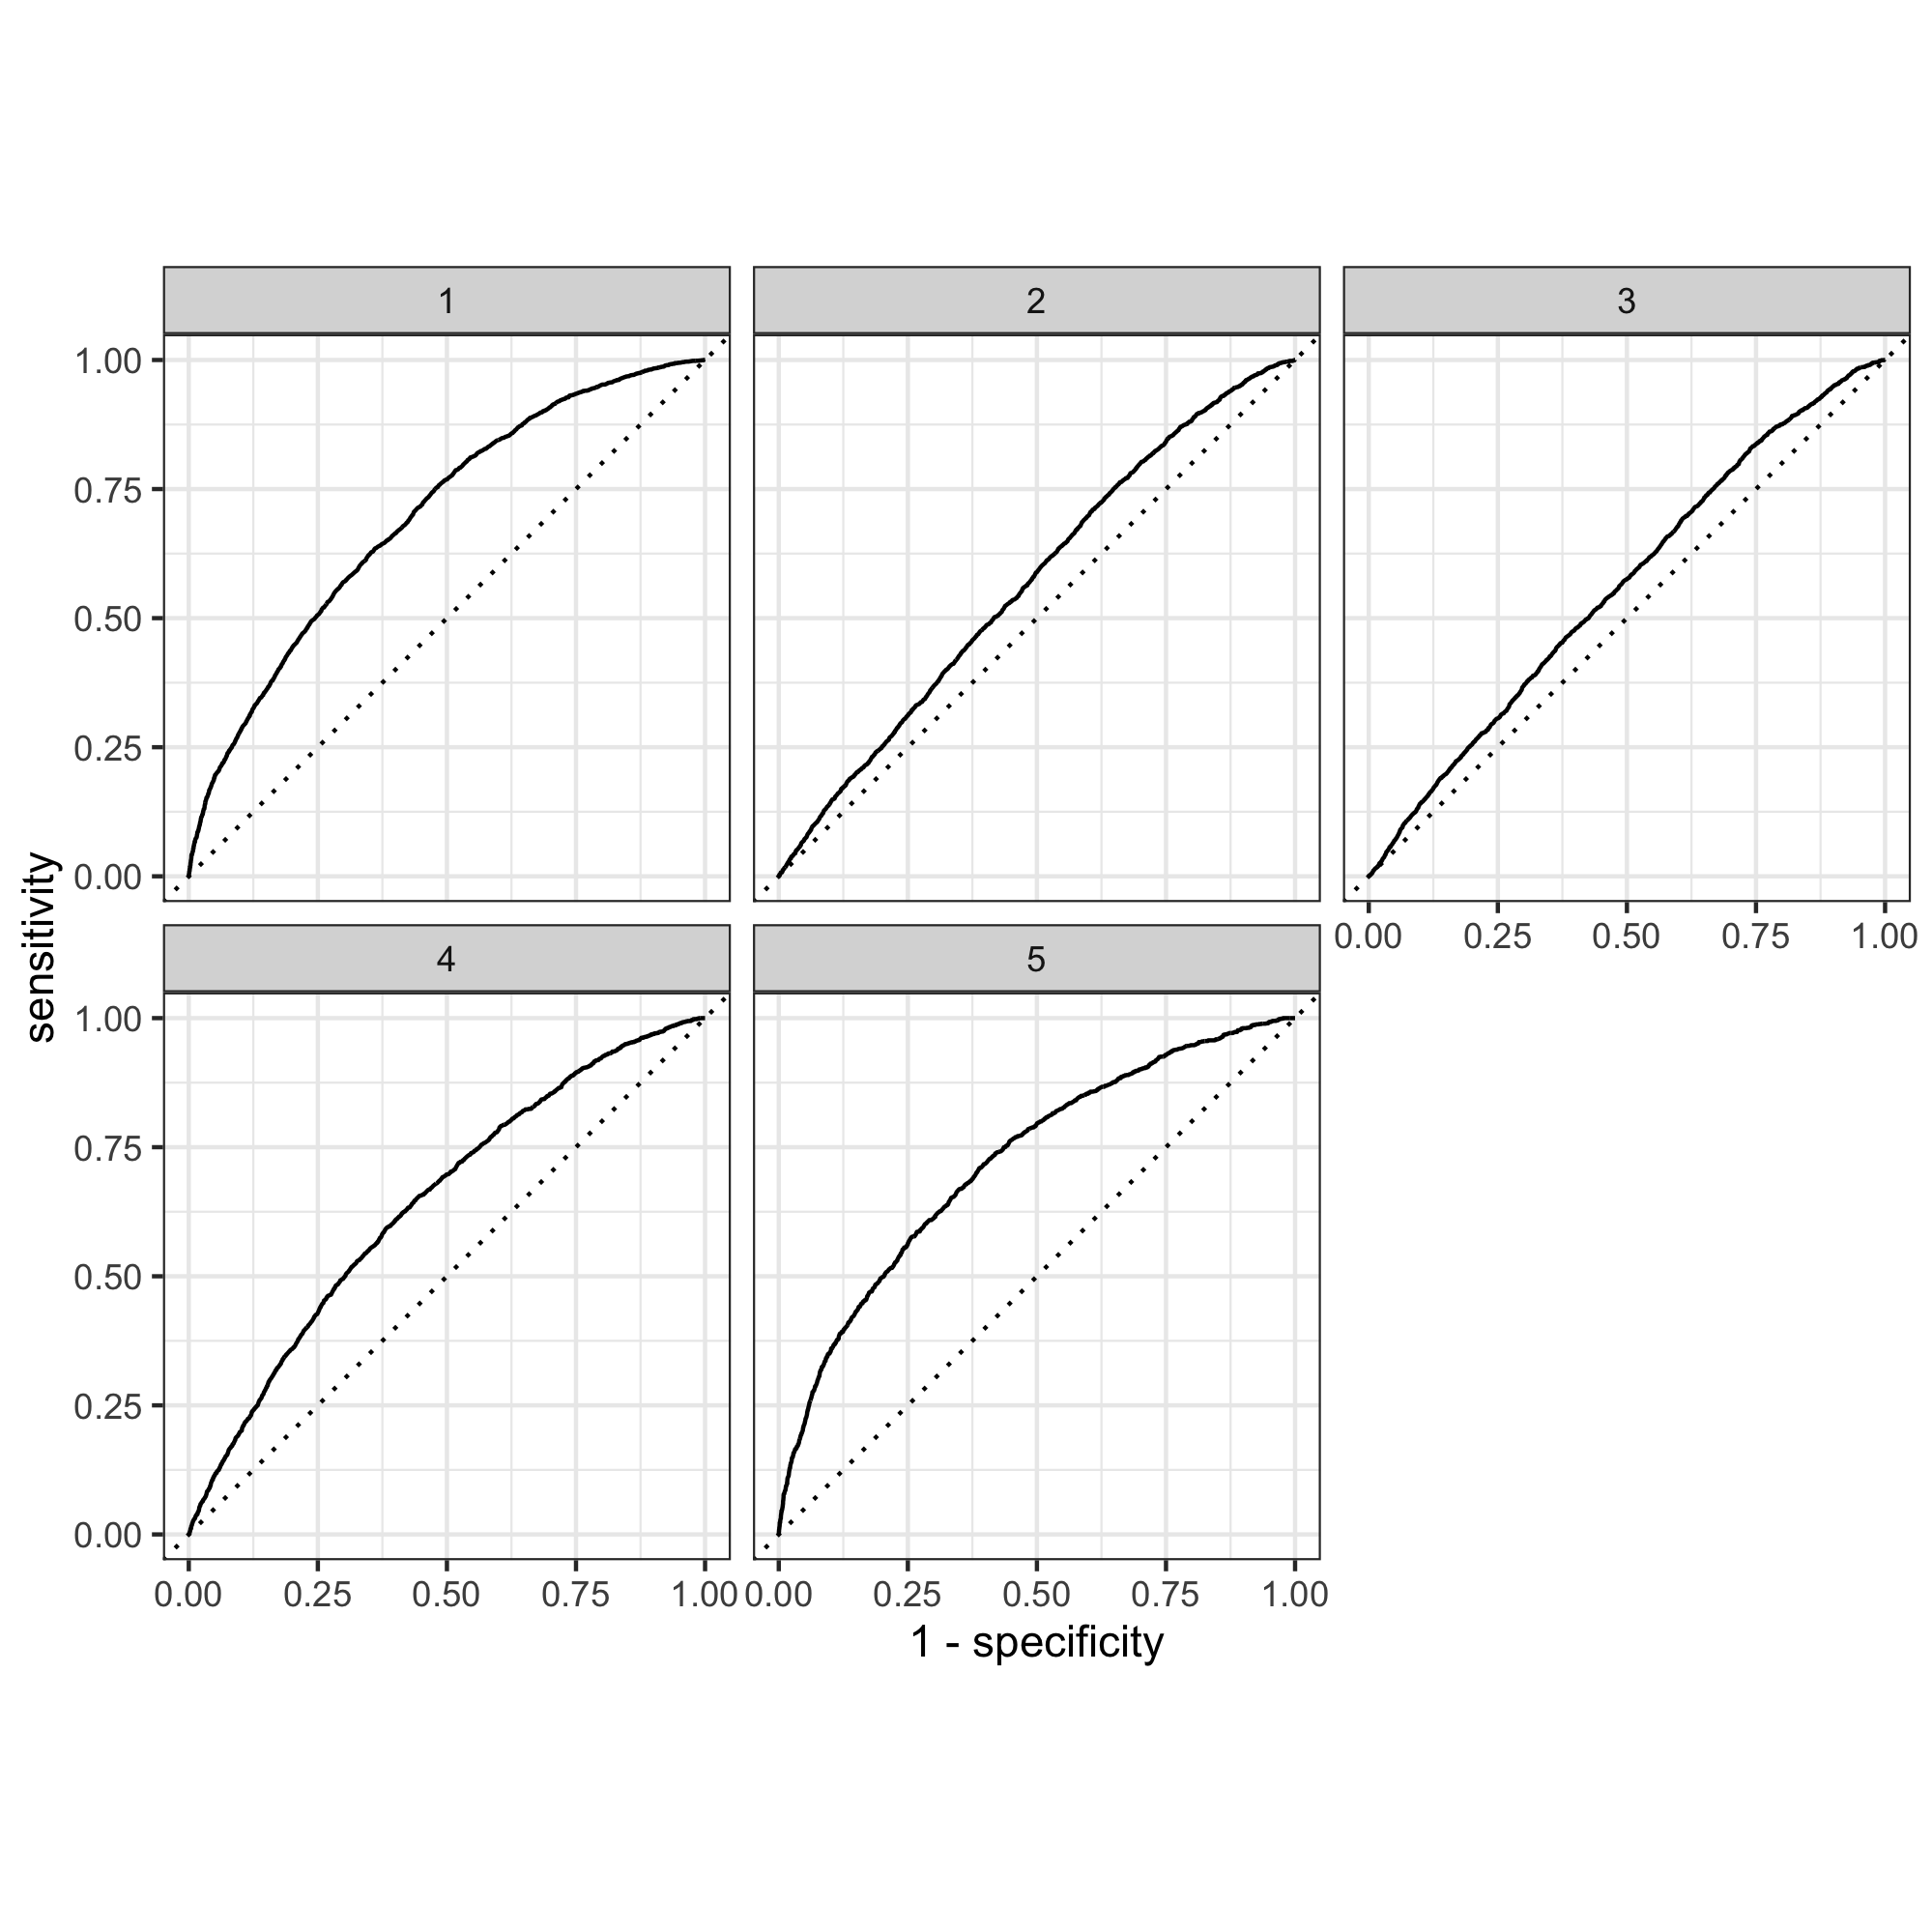
Same as with the logistic regression, these curves show that the model is better at detecting weath groups 1, 4, and 5, but not 2 and 3. This means that the model is not great at differentiating people that fit into the two middle wealth brackets.
-
Are you able to provide a plot that supports the relative importance of each feature’s contribution towards the predictive power of your random forest ensemble model?
-
Logistic Regression (TensorFlow)
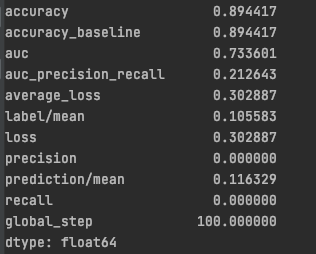
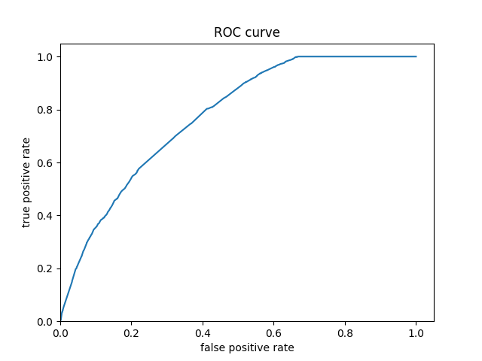
- Using the python script provided, train a logistic regression model using the tensorflow estimator API and your DHS data, again with wealth as the target. Apply the linear classifier to the feature columns and determine the accuracy, AUC and other evaluative metrics towards each of the different wealth outcomes. Then continue with your linear classifier adding the derived feature columns you have selected in order to extend capturing combinations of correlations (instead of learning on single model weights for each outcome). Again produce your ROC curves and interpret the results.
-
Evaluation Metrics
-
ROC Curve
-
Gradient Boosting Model
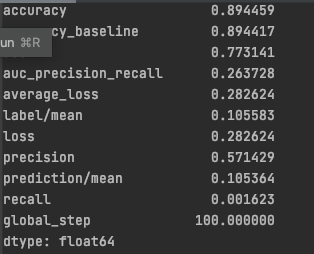
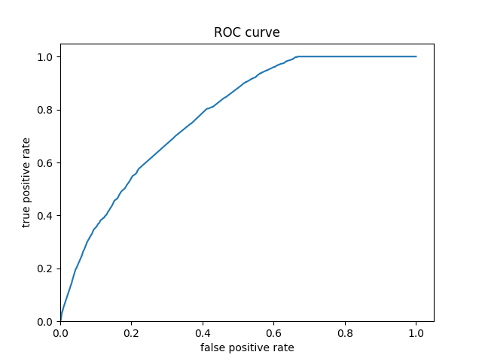
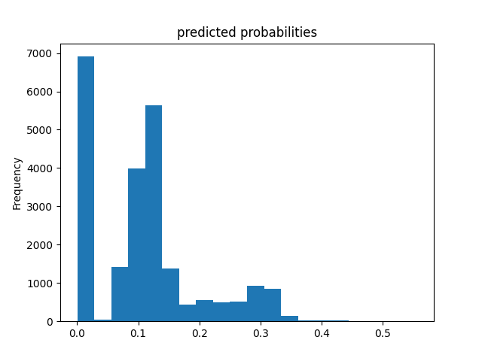
- Using the python script provided, train a gradient boosting model using decision trees with the tensorflow estimator. Provide evaluative metrics including a measure of accuracy and AUC. Produce the predicted probabilities plot as well as the ROC curve for each wealth outcome and interpret these results.
-
Evaluation Metrics
-
ROC Curve
-
Predicted Probabilities
-
Comparison of Four Models
- Analyze all four models. According to the evaluation metrics, which model produced the best results?
- Model four performed the best because it had an area under the curve of 0.77.
- Were there any discrepancies among the five wealth outcomes from your DHS survey dataset?
- The model was able to better predict the highest and lowest wealth classes for Jordan. This makes sense because characteristics for each would be more defining than characteristics corresponding to middle wealth individuals. In order to imropove the model for predicting wealth, you might need to consider integrating another factor that may have a high correlation to wealth. Some categories that were present in my dataset that might correspond to wealth are highest education level achieved and if a house had electricity.